
System Architecture
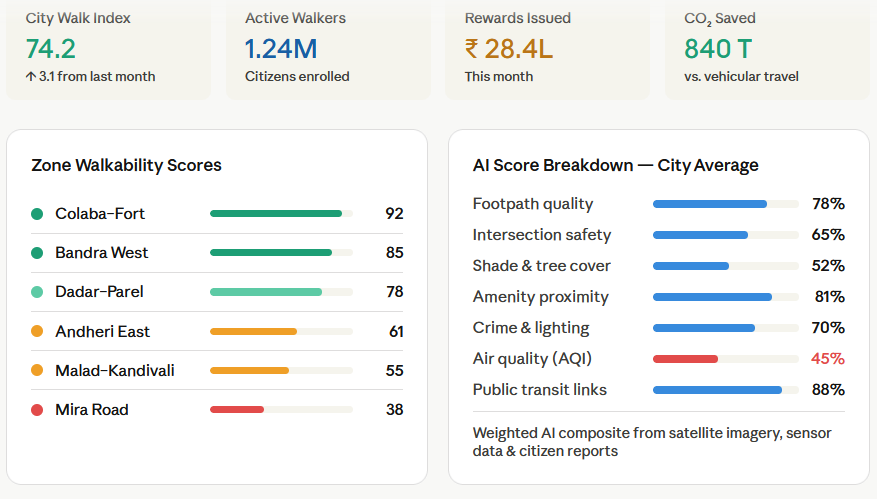
The platform has four layers working together. A data ingestion layer pulls from satellite/street-view imagery, IoT sensors (footpath quality, air quality, lighting), civic GIS data, and citizen reports via mobile app. An AI scoring engine processes these inputs using a weighted composite model — footpath quality, intersection density, shade cover, amenity proximity, lighting, AQI, and reported hazards — to produce a 0–100 walkability index per zone.
A citizen engagement layer connects to the scoring engine via a mobile app that uses GPS + accelerometer for step verification, with anti-gaming ML to flag vehicle-assisted fraud. Finally, a rewards engine maps earned WalkPoints to a partner redemption marketplace (transit discounts, grocery cashback, health checkups, etc.).
Key AI Components
The walkability scoring uses a computer vision pipeline (satellite + street-level imagery) to assess footpath continuity and quality, plus NLP on citizen hazard reports to prioritize civic fixes. A behavior analytics model personalizes challenges to individual citizens to maximize engagement. A fraud detection model cross-checks step data against GPS speed profiles to reject gaming.
How to Use the Dashboard
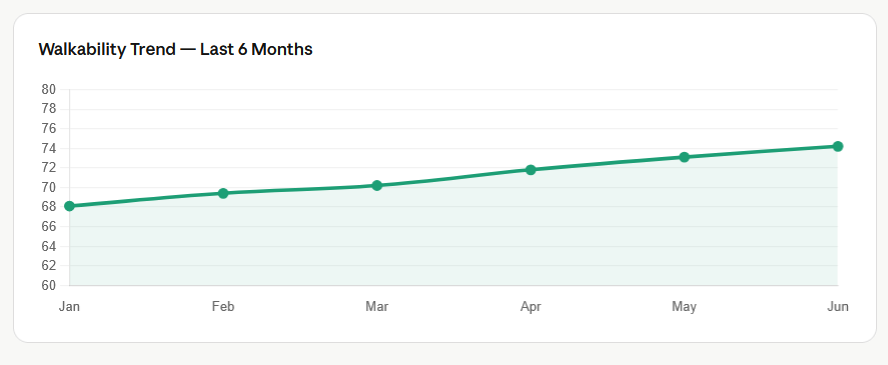
- City Overview — see zone-by-zone scores and trend data
- AI Zone Analyzer — drag sliders to simulate any zone’s parameters and hit “Run AI Analysis” for AI-powered recommendations
- Citizen Portal — shows a sample user profile, challenge progress, and community leaderboard
- Rewards Engine — shows the tier system, earning rules, and redeemable rewards catalog
Tech Stack Suggestion: React Native mobile app, Python/FastAPI backend, Google Maps + Vision API for imagery, PostgreSQL with PostGIS for geospatial data, and a rule-based + ML reward engine.
Would you like me to dive deeper into any component — such as the AI scoring model, mobile app design, or the rewards API architecture?
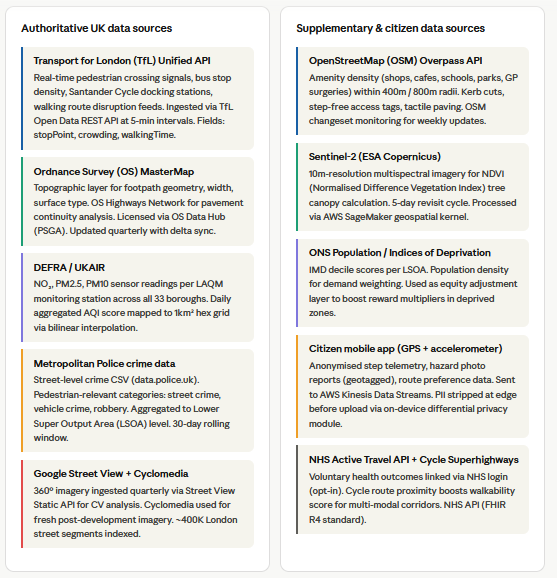
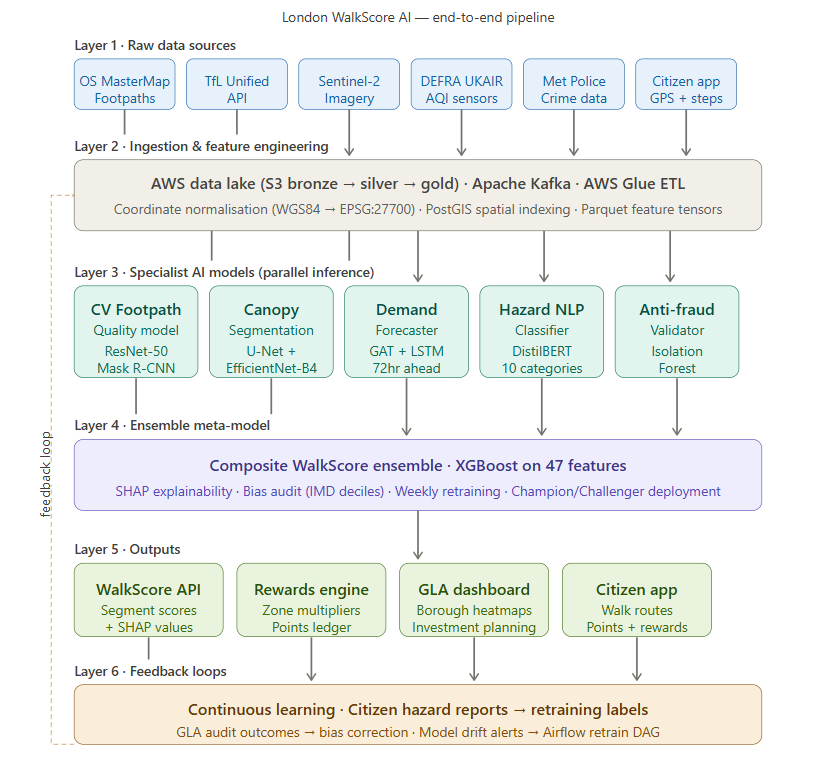
Data ingestion (18 sources) — the solution is anchored to authoritative UK open data: OS MasterMap for footpath geometry, TfL Unified API for pedestrian crossings and transit, Ordnance Survey for pavement continuity, DEFRA UKAIR for air quality, Metropolitan Police crime data, Sentinel-2 satellite imagery, and citizen GPS telemetry. All pipelines land in an S3 data lake (bronze → silver → gold zones) in AWS eu-west-2 (London) for UK data residency.
AI model pipeline — six specialist models run in parallel. The CV model (ResNet-50 + Mask R-CNN) analyses Street View imagery for pavement defects. A U-Net on Sentinel-2 computes tree canopy per 100m grid cell. A Graph Attention Network + LSTM forecasts pedestrian demand 72 hours ahead. DistilBERT classifies citizen hazard reports in real-time. An Isolation Forest validates walk authenticity to prevent reward fraud. All outputs feed an XGBoost ensemble meta-model that produces the final WalkScore with SHAP explainability for every prediction.
Scoring engine — a six-factor weighted formula (infrastructure 28%, safety 22%, environment 18%, connectivity 16%, inclusion 10%, demand 6%), calibrated via a 2,400-person stated preference survey of Londoners. Scores run from 0–100 across all 33 boroughs, from Westminster (88) to Havering (38).
Rewards engine — points vest after a 24-hour anti-fraud cooling period, with 2× multipliers in low-WalkScore improvement zones, and redemptions tied to genuinely London-specific partners: TfL Travelcard discounts, NHS health checks, Santander Cycles credits, Brompton Bicycle, and council tax micro-rebates. ROI model cites a £4.20 NHS long-term cost offset per £1 of reward spend.
Compliance is built in from the start — UK GDPR, the Algorithmic Transparency Recording Standard (ATRS), Equality Act 2010 bias audits, GOV.UK One Login for authentication, and NHS DCB0129 standards for health data.