
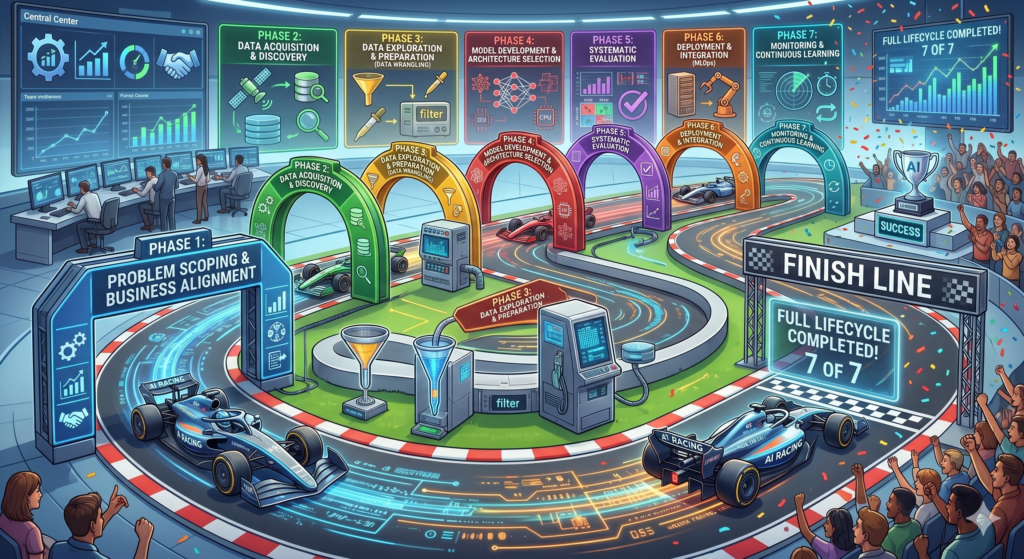
Managing an AI project is fundamentally different from traditional software development. While standard software is logic-driven, AI systems are data-driven, probabilistic, and iterative. To ensure success, teams use the AI Project Lifecycle Management framework.
Below is a detailed breakdown of the lifecycle, framed through a comprehensive, real-world case study.
The Case Study: SmartCart Logistics
- Company: A global e-commerce retail giant.
- The Business Challenge: High customer churn due to inaccurate “Estimated Time of Arrival” (ETA) predictions at checkout, leading to missed deliveries and overwhelmed customer support teams.
- The Solution: Build and deploy an AI-driven Predictive ETA Engine.
Phase 1: Problem Scoping & Business Alignment
Before writing code or collecting data, the business problem must be translated into an AI problem.
- Objective: Reduce the gap between predicted and actual delivery times by 35% within 6 months.
- The AI Translation: This is a regression problem. The system needs to predict a continuous variable (number of hours until delivery) based on real-time and historical inputs.
- Success Metrics:
- Business KPI: 15% reduction in “Where is my order?” support tickets; 5% increase in customer retention.
- Technical Metric: Mean Absolute Error (MAE) of the model should be less than 4 hours.
Phase 2: Data Acquisition & Discovery
AI models are only as good as the data fueling them. In this phase, data is pulled from disparate silos.
The data engineering team gathered data from three core sources:
- Historical Logistics Data: ERP databases showing past order dates, fulfillment center origins, and final drop-off times.
- Real-Time Data: APIs providing current weather conditions, traffic congestion, and carrier availability.
- Product Data: Dimensions, weight, and fragility of the ordered items.
⚠️ Guardrail Check: The legal and compliance teams stepped in during this phase to mask all Personally Identifiable Information (PII) like exact customer names and phone numbers to comply with GDPR and CCPA.
Phase 3: Data Exploration & Preparation (Data Wrangling)
Raw data is notoriously messy. This phase consumes roughly 60–70% of the total project timeline.
- Data Cleaning: The team found missing timestamps in historical carrier logs. Rows with critical missing data were dropped, while minor gaps were filled using interpolation.
- Feature Engineering: Raw data was converted into high-value signals:
- Combined Origin ZIP and Destination ZIP into a single
Distance_Milesfeature. - Extracted
Is_HolidayandDay_of_Weekfrom timestamps, as weekends drastically alter delivery speeds.
- Combined Origin ZIP and Destination ZIP into a single
- Data Splitting: The final clean dataset was split into:
- 80% Training Set: To teach the model.
- 20% Testing/Evaluation Set: Kept completely separate to grade the model later.
Phase 4: Model Development & Architecture Selection
With clean data ready, the data science team began experimenting with machine learning algorithms.
[Baseline Model: Linear Regression] ➔ [Champion Model: Gradient Boosting (XGBoost)]
- The Approach: The team started with a simple baseline model (Linear Regression) to establish a floor performance. They then graduated to a more sophisticated Gradient Boosting algorithm (XGBoost), which handles complex, non-linear relationships much better.
- Hyperparameter Tuning: Automated scripts ran overnight to fine-tune the model’s internal settings (like tree depth and learning rates) to squeeze out maximum accuracy without causing the model to memorize the training data (overfitting).
Phase 5: Systematic Evaluation
Before a model can touch live production traffic, it must prove its safety and accuracy.
- Quantitative Results: The XGBoost model achieved an MAE of 3.2 hours on the testing dataset, beating the target goal of 4 hours.
- Qualitative & Fairness Check: The data team checked for bias. They discovered the model was highly inaccurate for rural zip codes because it had less historical training data for those regions.
- The Fix: They synthetically up-sampled rural delivery data and retrained the model to ensure fair and accurate ETAs for all customers.
Phase 6: Deployment & Integration (MLOps)
A model sitting in a data scientist’s notebook provides zero business value. It must be integrated into the company’s application layer.
- Packaging: The trained model was containerized using Docker and deployed as a microservice via an API endpoint.
- Rollout Strategy (Canary Deployment): The team did not roll out the new AI ETA to 100% of users instantly. Instead, they routed 5% of live traffic to the AI model, while the remaining 95% used the legacy rule-based system. After two weeks of zero crashes and verified accuracy, traffic was ramped up to 100%.
Phase 7: Monitoring & Continuous Learning
AI models are dynamic; they naturally degrade over time as the real world changes. This is known as data drift.
- The Incident: Two months post-launch, a major shipping carrier changed its regional routing hubs, causing the model’s accuracy to plummet.
- The Solution (Automated MLOps Pipeline): An automated monitoring dashboard (using tools like Prometheus/Grafana) instantly flagged that the live data distribution no longer matched the training data distribution.
- The Loop: An automated trigger initiated a retraining pipeline, ingesting the last 30 days of new carrier data, optimizing the model, and deploying an updated version seamlessly without downtime.
Key Takeaways from the Case Study
| Lifecycle Phase | Core Risk | How SmartCart Mitigated It |
|---|---|---|
| Scoping | Building AI for a problem that doesn’t need it | Aligned technical metrics (MAE) directly with business KPIs (Churn). |
| Data Prep | “Garbage in, garbage out” | Spent the majority of the timeline cleaning and engineering smart features. |
| Evaluation | Hidden algorithmic biases | Performed sub-group analysis on rural vs. urban performance. |
| Monitoring | Model degradation (Drift) | Implemented continuous monitoring and an automated retraining loop. |